Identify pain points easily to drive more profit
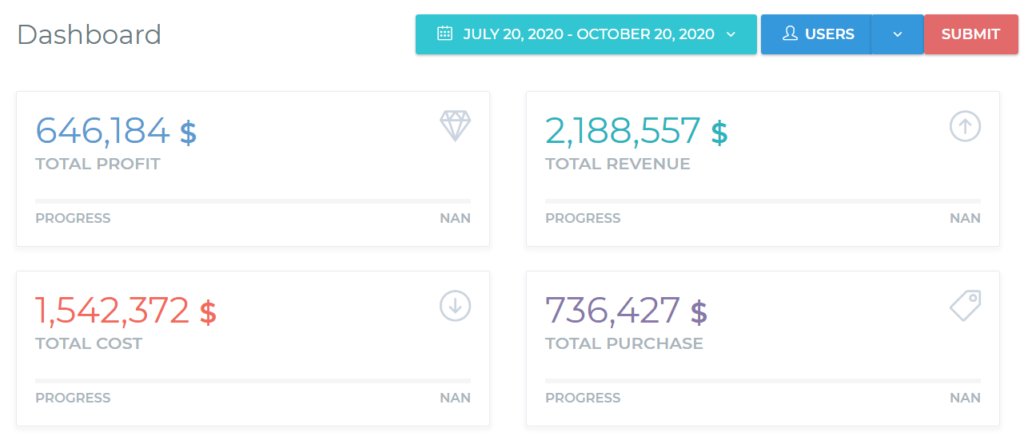
View the dashboard to find out profitability, revenue, cost, and total purchase information for the whole company or for one or more team members. Filter the data by a date range and view year-over-year progress by comparing profitability with the same period in the previous year


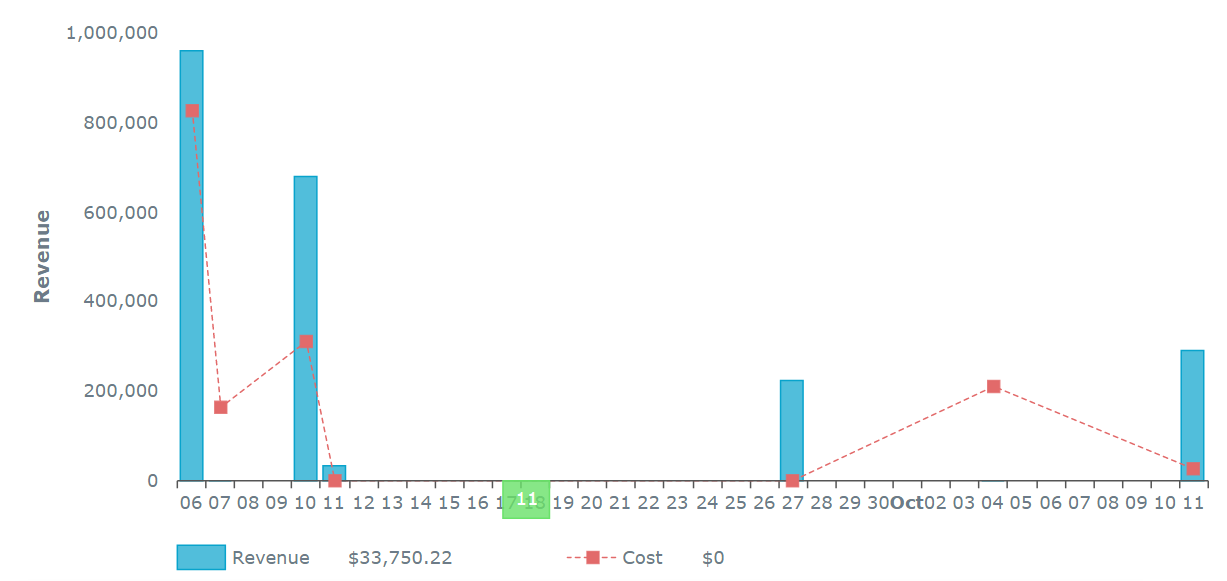
Get a visual and interactive representation of how your revenue and cost moved over a selected period. Filter the report by one or more team members or generate the report for the whole company
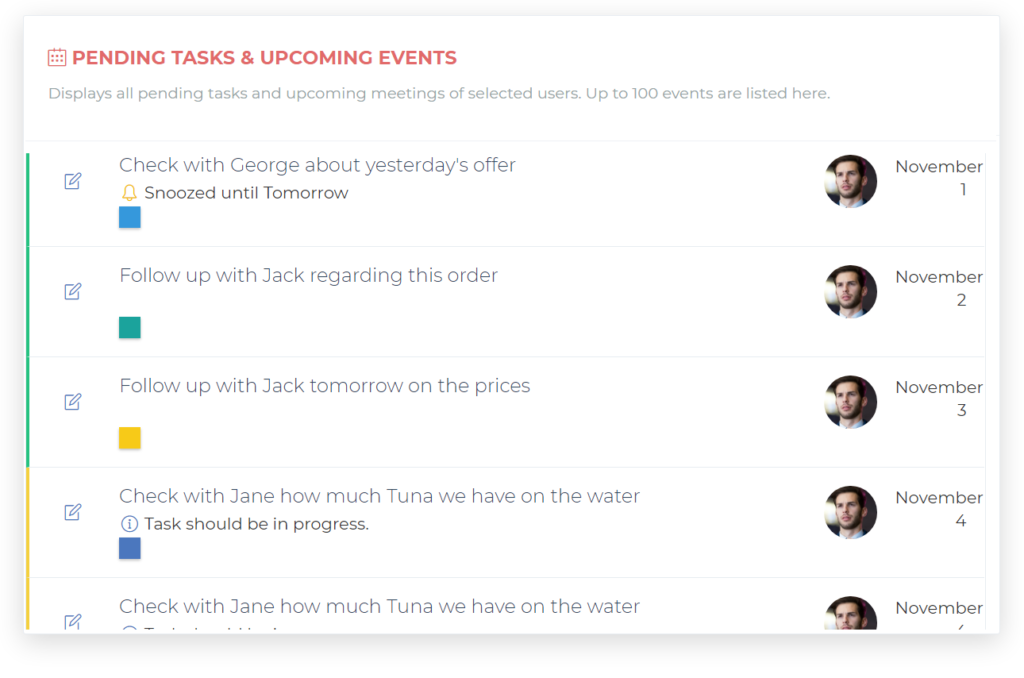
View all pending tasks and upcoming meetings of one or more team member to find out what they are working on


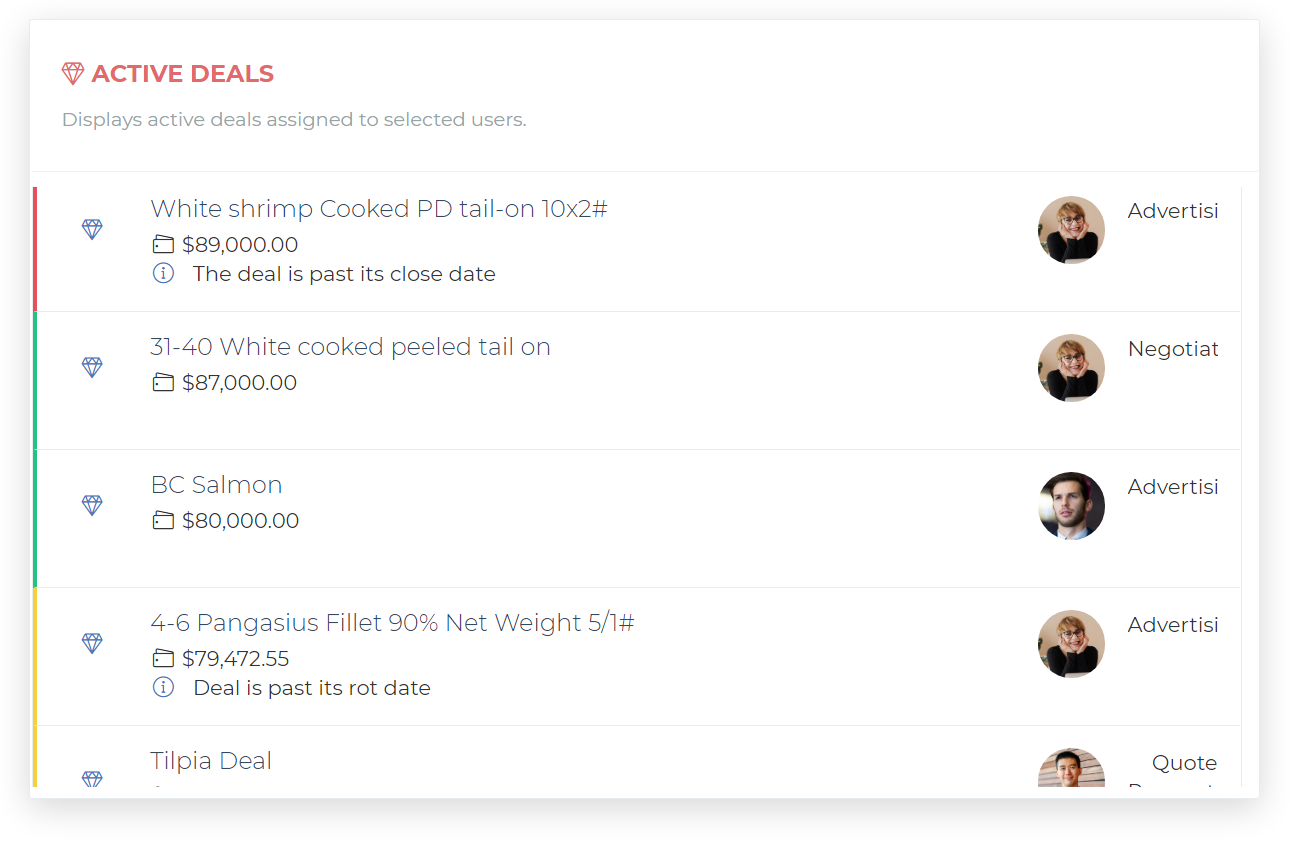
View all active deals assigned to one or more team member to see how they are progressing
14-day Free trial. Full access. No credit card required.